Pupil attendance is never straightforward. Raw figures don’t convey the whole story, and it can take a great deal of data manipulation to get the answers you need for your trust, school and governors.
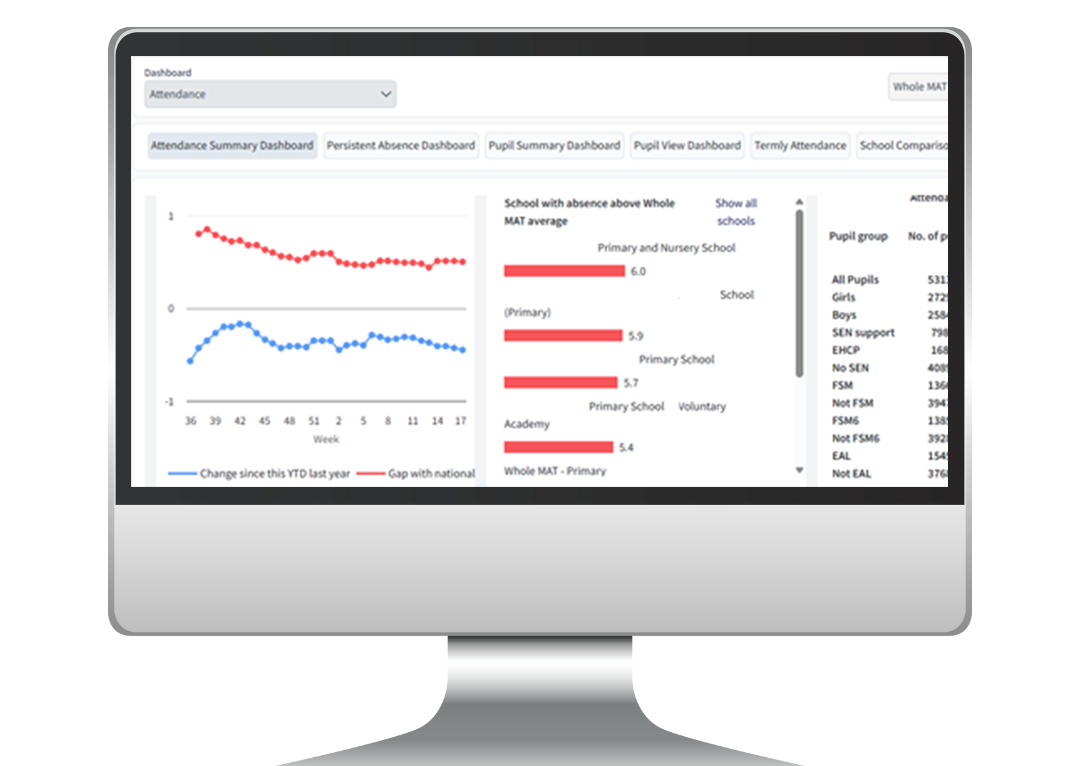
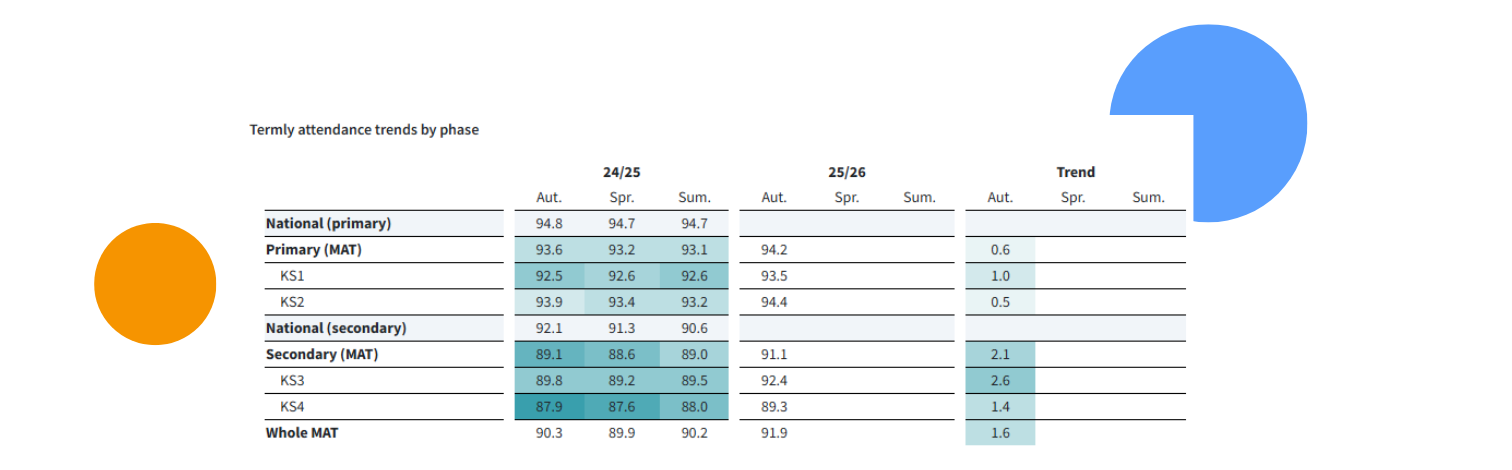
MATpad provides detailed breakdowns of all your attendance figures, including yearly and termly trends.
Persistent absence is a growing concern in many schools. Through MATpad’s attendance dashboards, you can spot gaps between your schools and national figures and identify outliers amongst your schools, as well as breakdowns by pupil groups.
Instant downloadable reporting
MATpad securely collects data from your school systems in-line with all GDPR policies and will never ask for any information you don’t already hold.
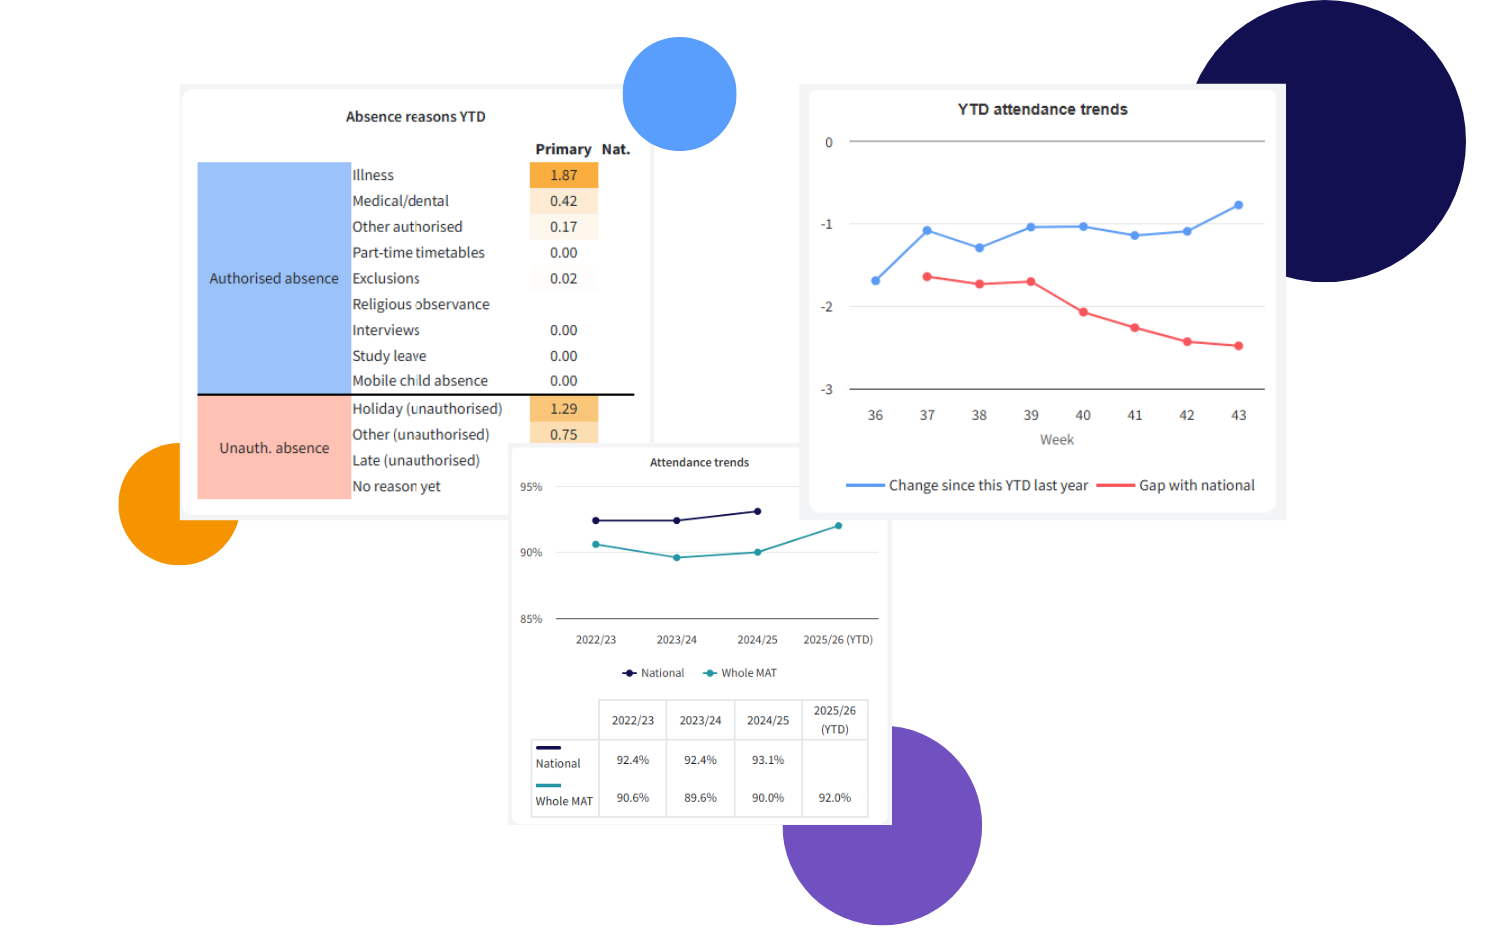
Using our Pupil Picker tool, you can drill down to view detailed graphs for individual student who may be of particular concern. Our dashboards will show you breakdowns by weekly cumulative attendance, absence reason, and more.
Zoom in on the details that matter
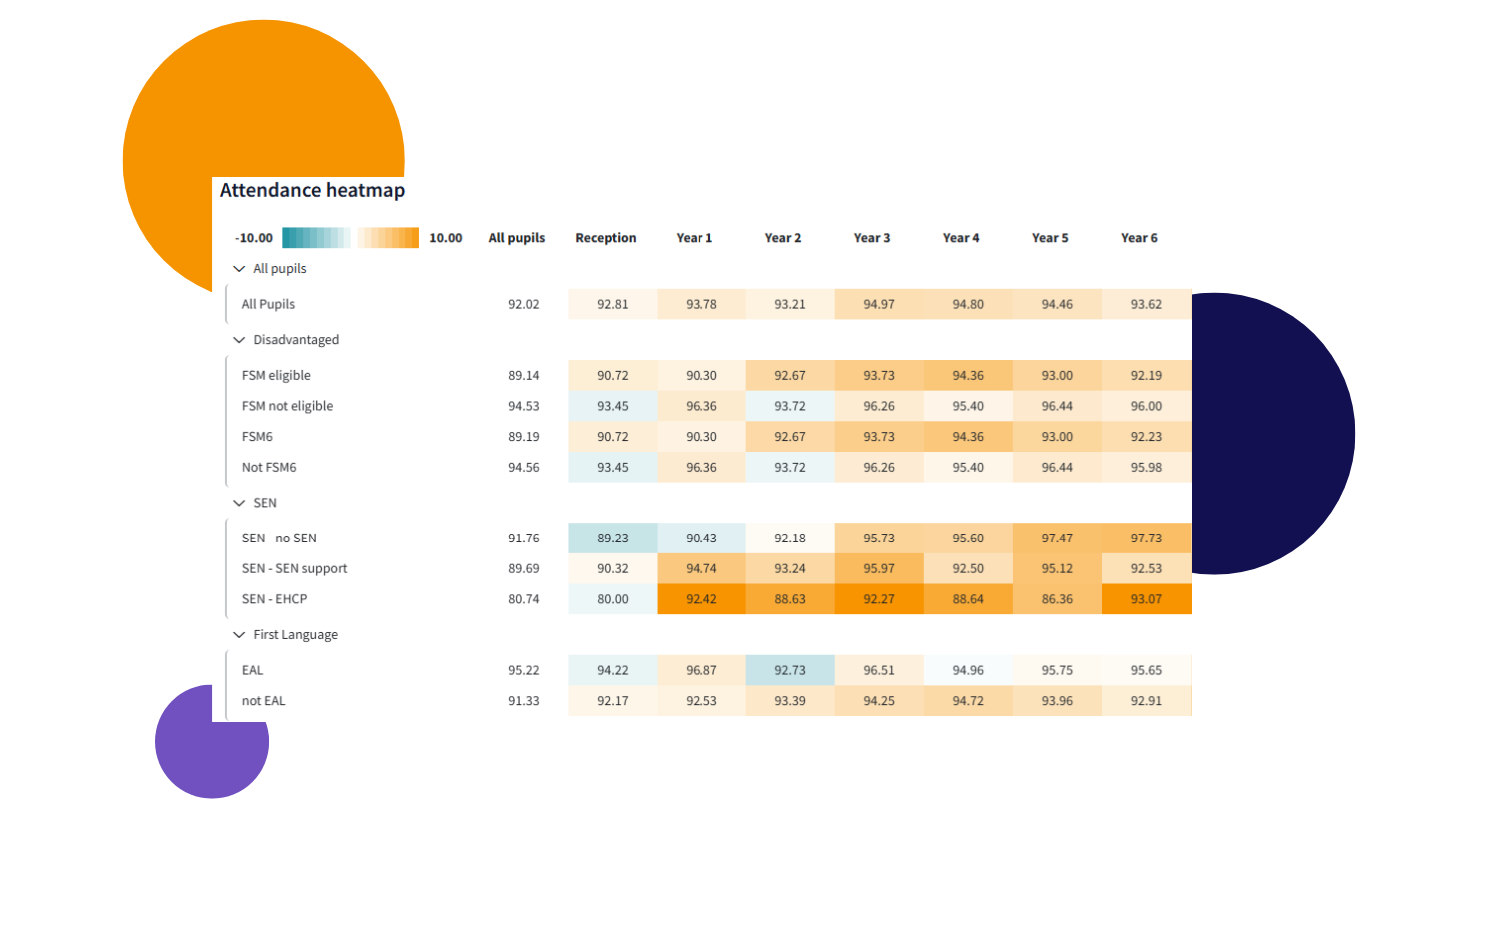
With MATpad’s Pupil Picker tool and Attendance Heatmap, schools can identify attendance patterns at both individual and cohort levels. Spot trends, flag concerns, and take action, without the spreadsheet headache. These tools turn raw data into clear, actionable insights that help you support every pupil.
In-depth Attendance Reporting Starts Here
Want to make the most of your attendance reporting? MATpad helps trusts and schools interrogate their data down to a granular level with ease, through simple to understand graphs and tables. Book a free demo and see how MATpad can transform your attendance reporting process.